Usage
Monitoring
Monitoring
Quotio provides a dashboard to visualize your AI consumption. This helps in auditing costs and identifying which tools or workflows are consuming the most tokens.
The Dashboard
Access the dashboard from the main app window by selecting the Dashboard tab in the sidebar.
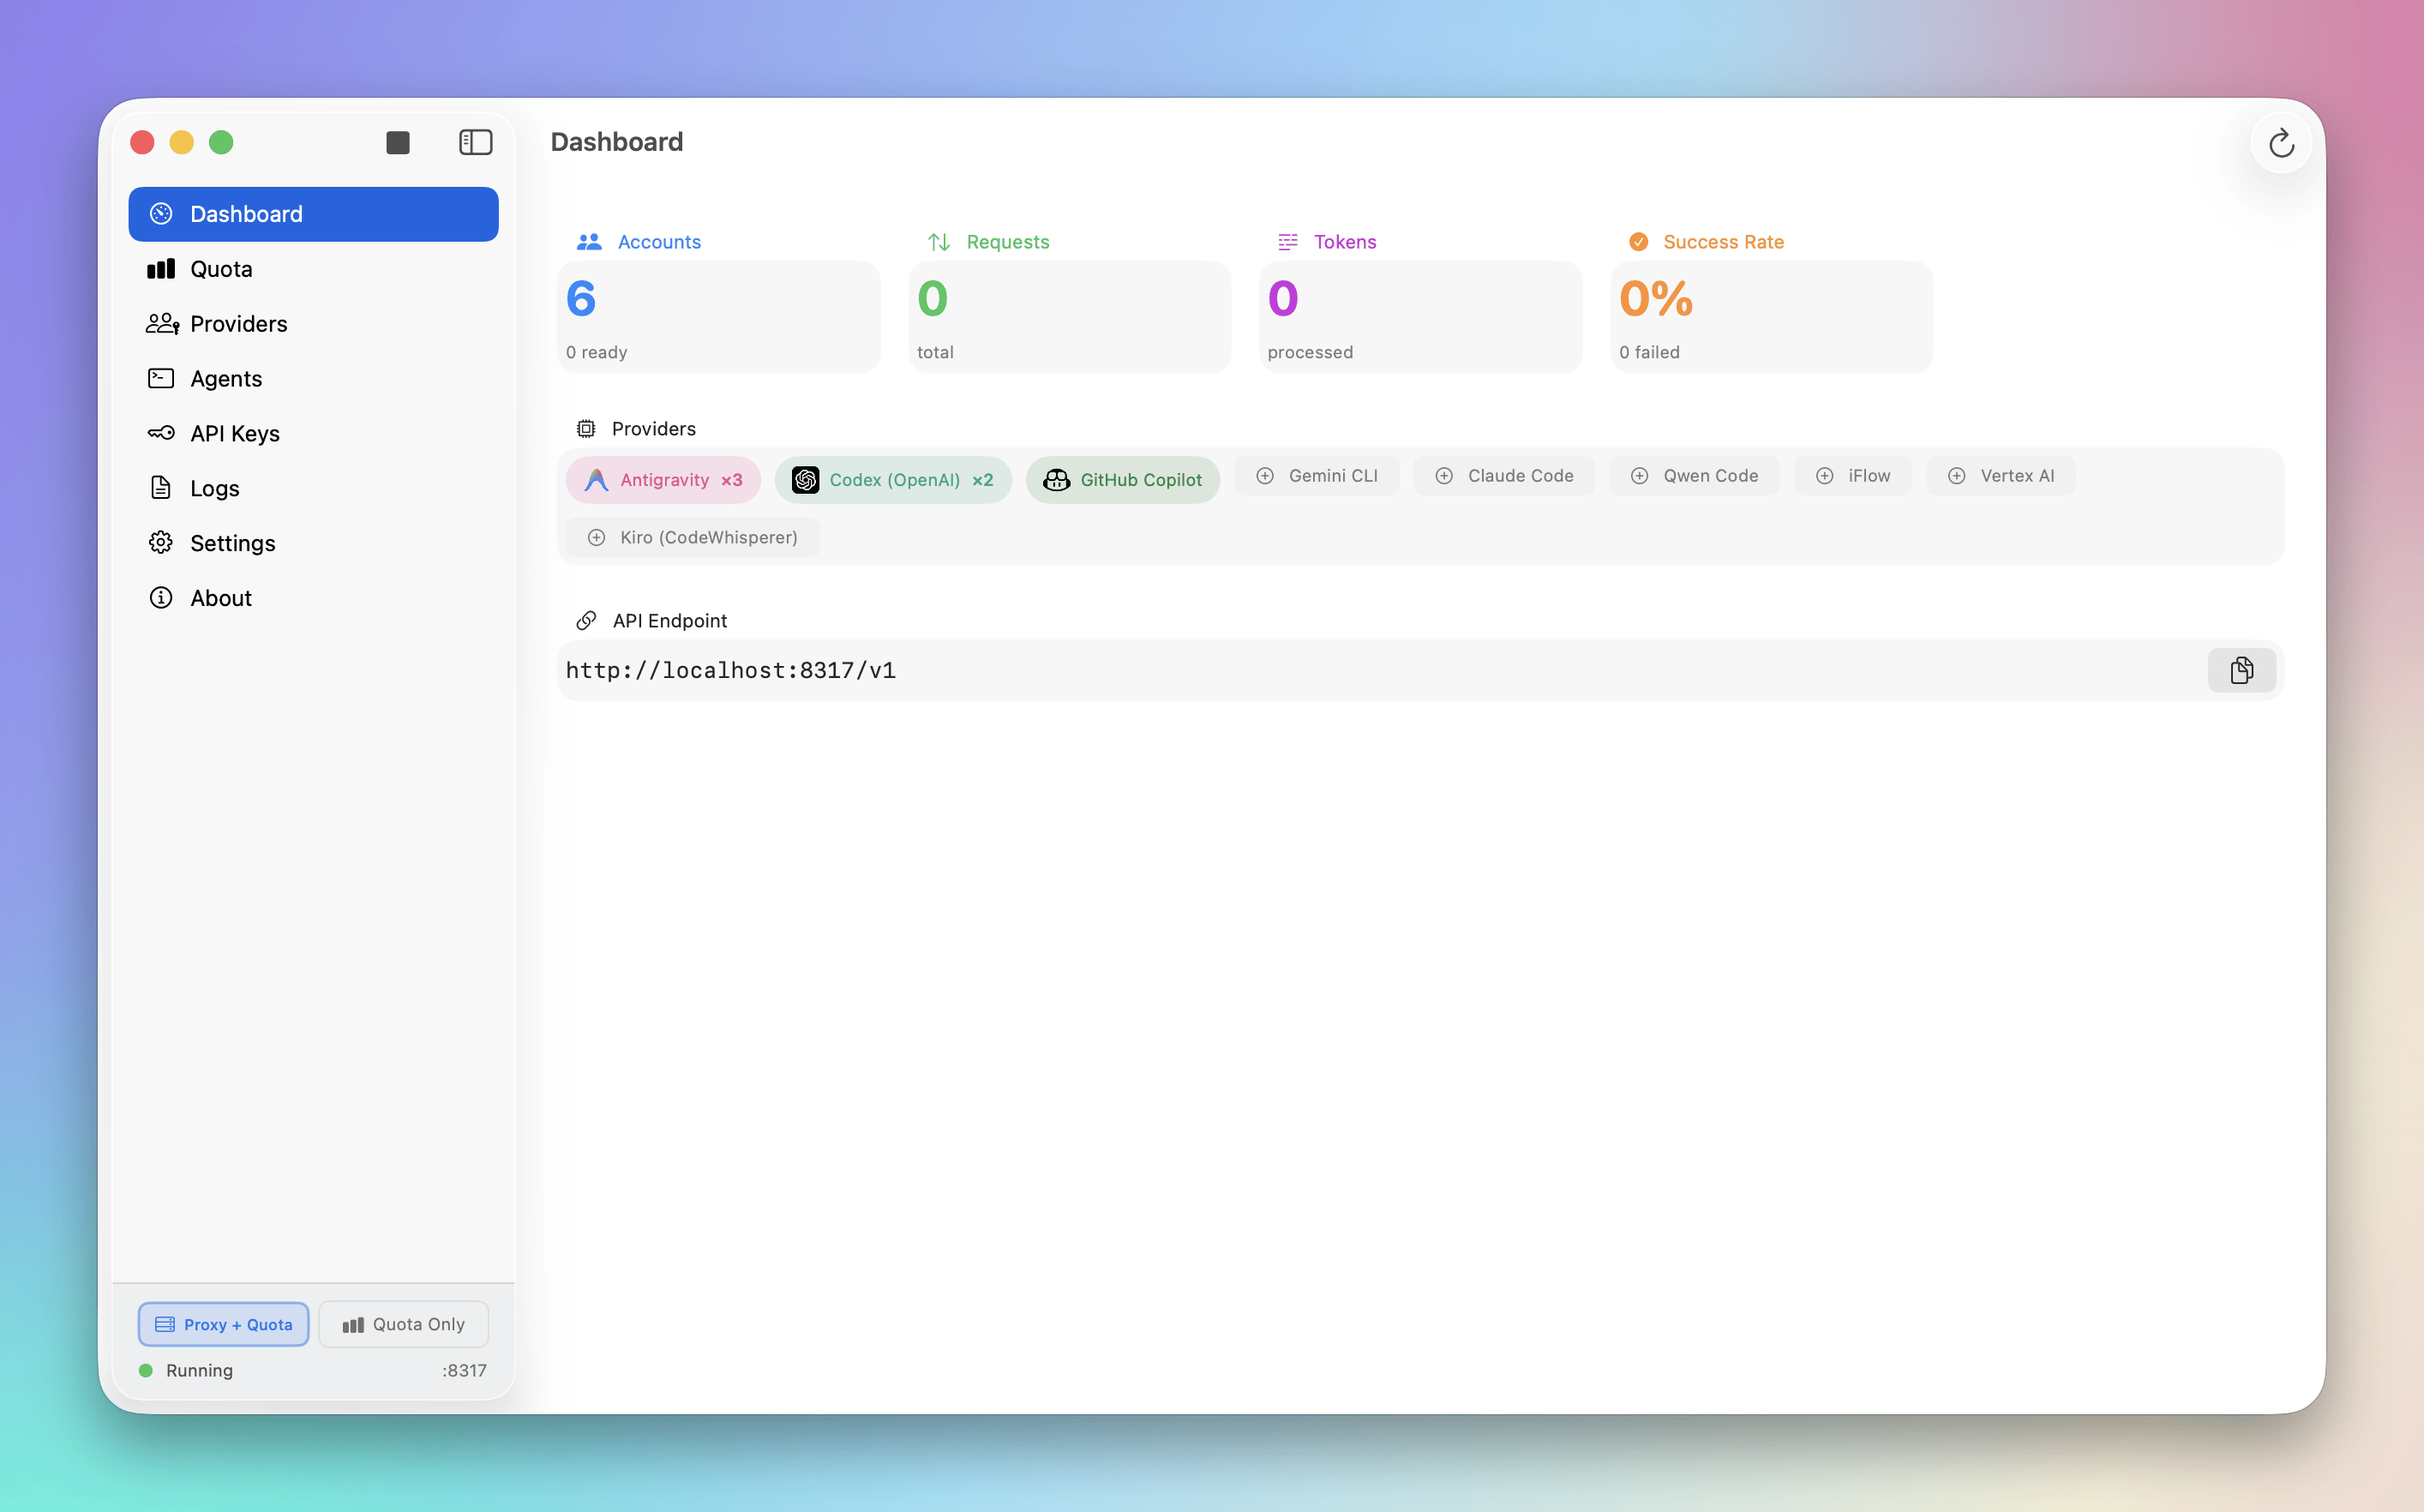
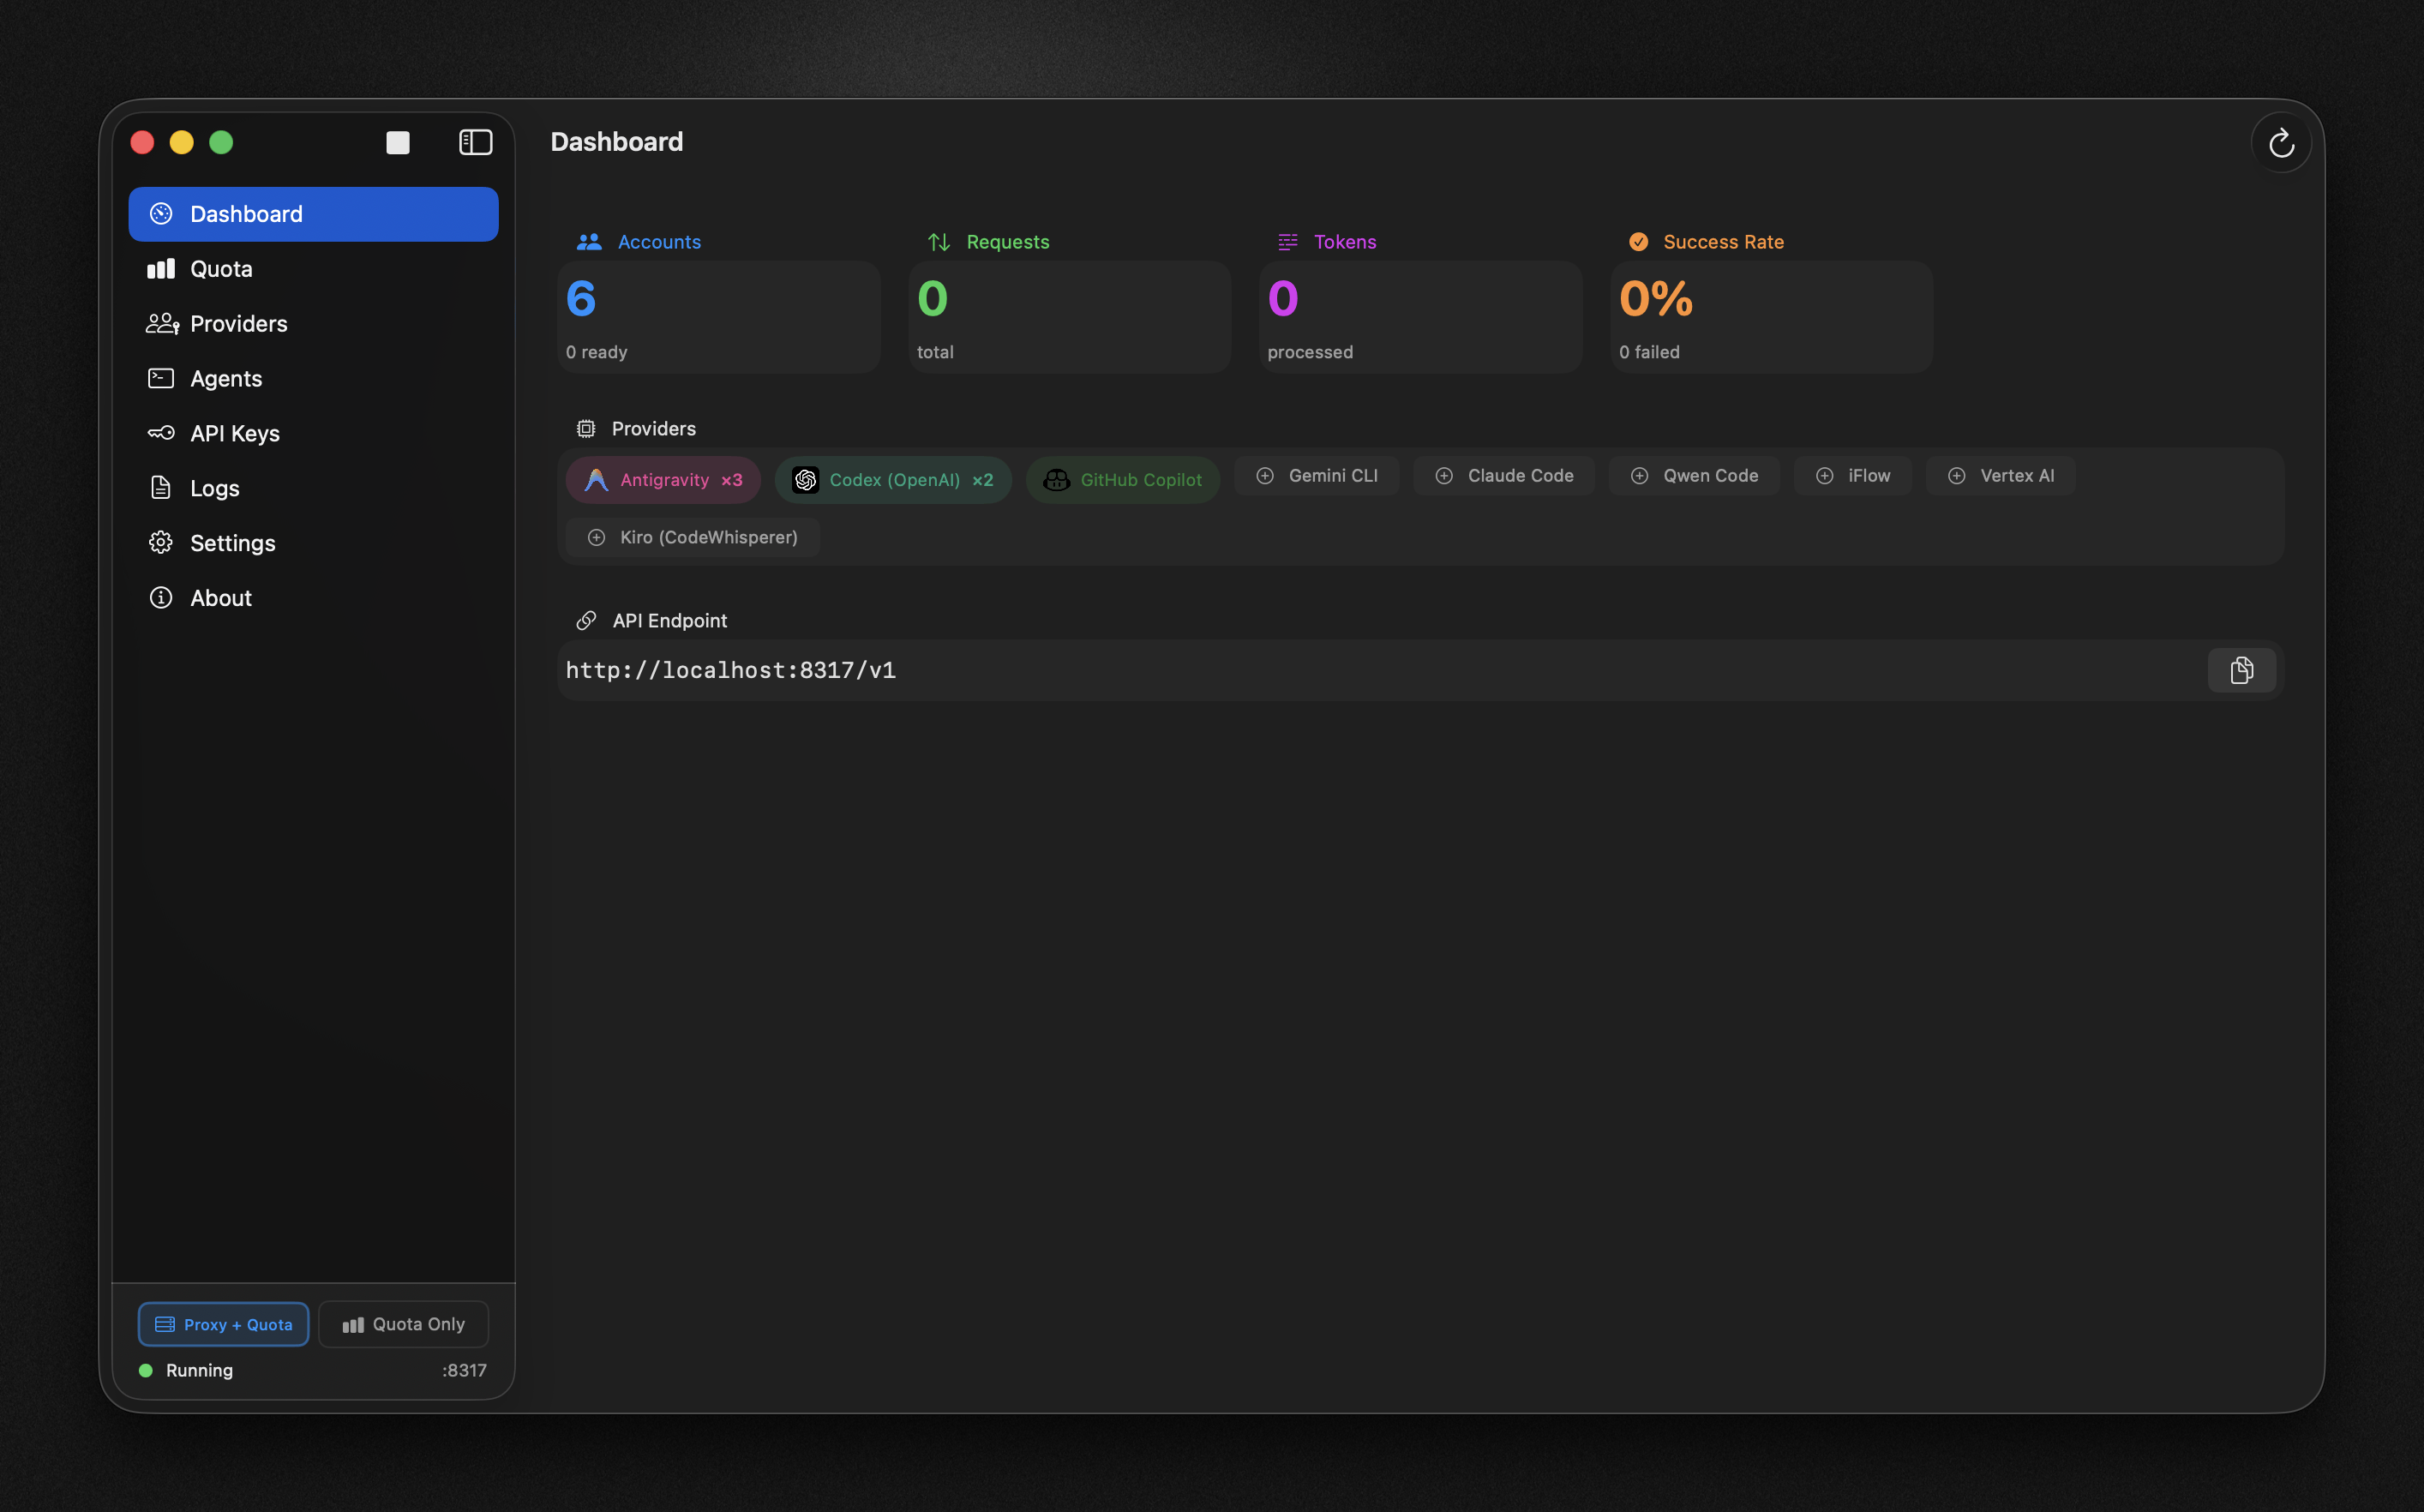
Overview Metrics
Displays key performance indicators:
Full Mode:
- Accounts: Total accounts and ready status
- Requests: Total API requests processed
- Tokens: Total tokens processed
- Success Rate: API call success percentage
Quota-Only Mode:
- Tracked Accounts: Number of accounts being monitored
- Connected Providers: Number of active providers
- Lowest Quota: Minimum remaining quota percentage
- Last Refresh: When data was last updated
Provider Status
Shows the current status of connected providers:
- Connection status (Ready, Error, Rate Limited)
- Quota percentages for each model
- Last activity timestamps
Real-time Menu Bar Stats
The menu bar dropdown provides live statistics:
- Total ready accounts and providers
- Recent request counts and success rates
- Quota status for tracked accounts
Logs
For detailed monitoring, view application logs in the Logs tab:
- Real-time log streaming from CLIProxyAPI
- Filter by log level (All, Info, Warn, Error)
- Search functionality
- Auto-scroll option
Access logs from the main app window sidebar.
Next Steps
Diagnose common issues with connections and limits.